| Photoiupac home page | Discussion | Photobiology.com home |
High fluorescence emissions of some natural benzofurane derivatives isolated from Styrax officinalis
Serap Alpc, Sıddık Içlia,, Andrey O. Doroshenkob, Hüseyin Anıla, Bircan Dindara,
Özgen Alankus-Çaliskana and Yurdanur Yaylaa
a
Department of Chemistry, Faculty of Science, Ege University,35100 Bornova, Izmir Turkeyb Institute for Chemistry at Kharkov State University, 310077 Kharkov Ukraine
c
Department of Chemistry, Faculty of Education, Dokuz Eylül University, Buca, Izmir TurkeyAbstract
The fluorescent properties of several natural benzofuran derivatives, egonols, isolated from Styrax officinalis, were determined. The studied egonol derivatives were found to be effective UV organic luminophores, with quantum yields of near to unity, j f = 0.92. The fluorescence quenching experiments with electron donor molecules of aniline, N,N,dimethylaniline and carbazolocarbazole, presented very high efficiency of quenching at above diffusion quenching rates of 4.5x10¹⁰, 2.1x10¹¹ and 5.6× 10¹² s-1× mol-1, respectively. A strong electron acceptor molecule, tetranitrofluorenone, presented quenching rate of 2.6x10¹¹ s-1× mol-1. It is concluded that the first excited singlet state of egonol molecule is a more efficient electron acceptor.
Keywords: Fluorescence emission, Styrax officinalis, egonol, benzofuran, fluorescence quantum yields, fluorescence quenching.
Introduction
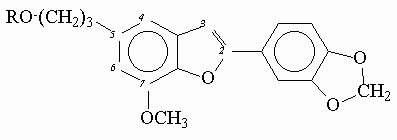
Egonol is a natural benzofuran glycoside occurring widely in Styrax officinalis [1]. First it was isolated by Okada from the seed-oil of Styrax japonicum [2]. The structure was suggested as 5-(3-hydroxypropyl)-7-methoxy-2-(3,4-methylenedioxyphenyl)benzofuran, egonol and confirmed in several later publications[3]. There are also some evidences about the isolation of other derivatives of benzofuran in similar structures [4,5]. Anıl [6] has reported the isolation and the justification of molecular structure of four benzofuran glycosides from the seeds of Styrax officinalis.
Photochemical and photophysical properties of natural products are important as routes to discovery of organic and bio-organic mechanisms under solar conditions. But no investigations are found to be reported on luminescent properties of these natural egonols. In this report we wish to present the results of our studies on fluorescence parameters of several egonols and fluorescence quenchings with strong p -electron donors and acceptors.
Following three derivatives were investigated for their photochemical properties.

R= H(I), Egonol; R= Acetyl(II), Egonol acetate; R= Triglycoside(III), Egonol triglycoside
Experimental
The separation, identification, and purification of the title compounds were described earlier [6,16]. Aniline and N,N-dimethylaniline were distilled before use at quenching experiments. The electronic absorption spectra were measured on UV-1601 Shimadzu spectrophotometer, fluorescence excitation and emission spectra were determined on PTI QM1 fluorescence spectrometer, at a bandwidth of 1 nm, optical densities on excitation and emission wavelengths during the measurements of quantum yields and quenching experiments were determined on spectrometer Spectronic 601. Quantum yields were measured with respect to quinine sulfate solution in 1N H2SO4 (j f = 0.546 [7]). Quantum-chemical calculations were made by a semiempirical full-valent method AM1 [8]. Methanol was supplied from Merck in Uvasol grade.
Correction of fluorescence intensity on inner-filter (the decreasing of fluorescence output with the increasing of absorbance on the excitation wavelength) and reabsorption (the decreasing of fluorescence output with the increasing of absorbance on the emission wavelength) effects during the quenching experiments were made as shown by Miller [9]. The true fluorescence intensity data were calculated from the experimental values according to the following equations:
F0 = Fexp ´ Cinner-filter ´ Creabsorption (1)
![]() (2)
(2)
![]()
(3)
The geometric parameters (x1, x2, y1 and y2), necessary for the calculation of correction factors by eq. (2) and (3), are substantially dependent from the adjustment of optical parts of the fluorescence spectrometer. The evaluations of above parameters for experiments in PTI QM1 device are described below.
Experimental correction factors for inner-filter effects were obtained for quinine sulfate solutions in aqueous 0.1 molar H2SO4 at increasing concentration of added acetone which absorbed light in short-wavelength spectral region (figure 1).
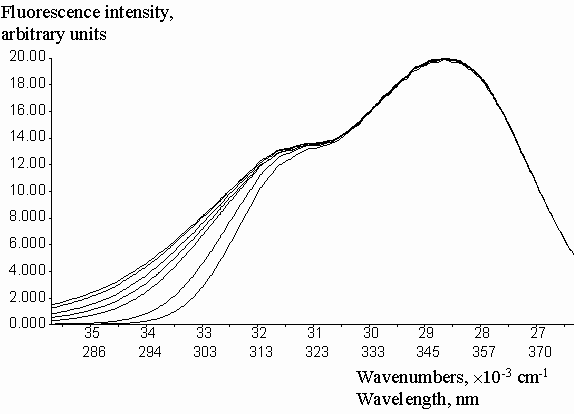
Figure 1. Fluorescence excitation spectra of quinine sulfate with increasing concentrations of added acetone.
Geometric parameters x1 = 0.2786 and x2 = 0.6826 were calculated by the fitting of experimental Cinner-filter data from optical density on the excitation wavelengthes (DEX). The equation (2) was used with the algorithm of Fletcher-Pauell and by application of a non-linear least squares method (figure 2).
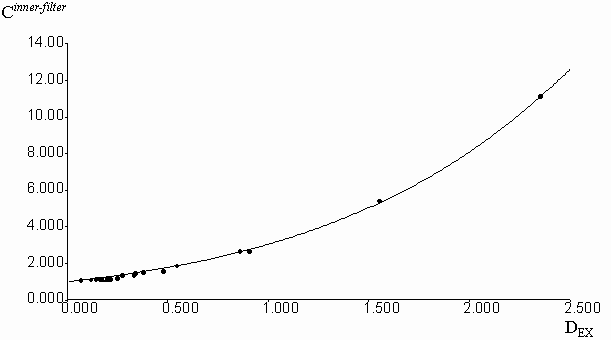
Figure 2. Fitting of the experimental correction factors data for inner-filter effect from the optical density on the excitation wavelength by non-linear least square method.
Experimental correction factors for reabsorption effect were obtained for quinine sulfate solutions in methanol, acidified by a small amount of 0.1 molar aqueous H2SO4, at increasing concentrations of fluorescein, which absorbed and emitted light in long-wavelength spectral region (figure 3). Absorption and emission data were collected in the spectral region free from fluorescence of added fluorescein. Fluorescence intensities were previously corrected on the inner-filter effect by the equation (2). Geometric parameters y1 = 0.2459 and y2 = 0.7462 were calculated by the fitting of experimental Creabsorption data from optical density on the emission wavelength (DEM). The equation (3) was used with the algorithm of Fletcher-Pauell and by application of a non-linear least squares method (figure 4).
Results and discussion
In order to be able to interpret the experimental results correctly, we have evaluated the molecular structure of egonol compound at semi-empirical calculations. The structure of the main chromophoric fragment of the isolated egonol from Styrax officinalis, was calculated by
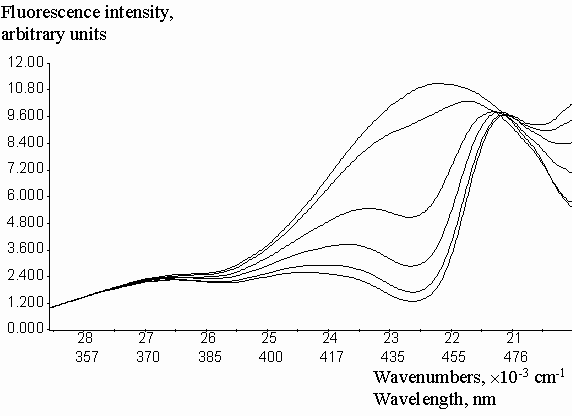
Figure 3. Fluorescence emission spectra of quinine sulfate in acidified methanol with increasing concentrations of added fluorescein.
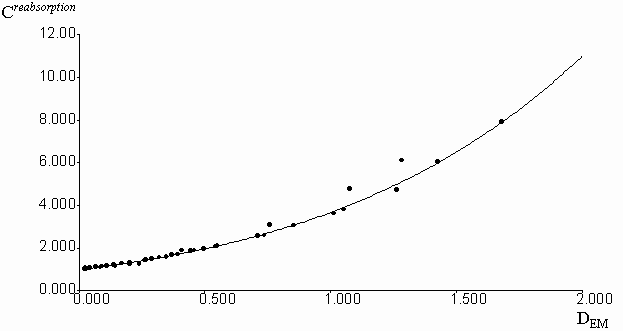
Figure 4. Fitting of the experimental correction factors data for reabsorption effect from the optical density on the emission wavelengthes by non-linear least square method.
the use of AM1 method with a full optimisation of molecular geometry. It was found, that, on the contrary to biphenylic compounds, the egonol molecule is practically planar. The interatomic distance between the hydrogen atom in position 3 of benzofuran cycle and ortho-hydrogen of 2-phenyl moiety was calculated to be about 2.3 Å , which is very close to the sum of the corresponding Van-der-Waals radii. The conclusion can be made that no sterical hindrance is present in the natural egonol molecules. Also there are no chromophore groups in egonol molecule, which could cause the appearance of np *-states. In most cases, effective intersystem crossing with the participation of singlet or triplet states of np * type results in complete diminish of fluorescence or observation of low fluorescence in conjugated organic molecules [10-12]. Thus one may predict that natural egonols can be effective organic luminophores.
The spectral characteristics of the studied compounds in methanol solutions are presented in table 1, the typical fluorescence spectrum is shown in figure 5. In agreement with theoretical approaches, natural egonols are found to fluoresce very effectively, with quantum yield values reaching to unity, j f = 0.92. 5-O-acylation and 5-O-triglycoside substitution on the egonol molecule, do not affect the high fluorescence emission (table 1). Egonols are seen to be effective natural organic luminophores for near UV region (figure 5). Unsubstituted benzofurane is reported to have a fluorescence quantum yield of j f = 0.63 and a phosphorescence quantum yield of j ph = 0.24 [13]. Absorption of egonols, 290-340 nm lies in the short UV end region of solar radiation spectrum. Thus, one can comment that egonols may be one of the organic luminophores in structure of plants, that may transfer the solar light into some photochemical processes.
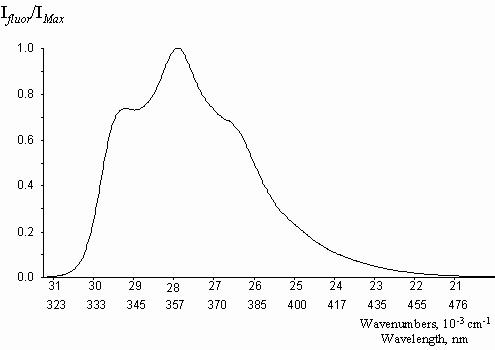
Figure 5. The absorbtion, A, and the fluorescence, B, spectra of egonol (I) in methanol,
l exc= 317 nm, ([ c] = 10-5 m).
Table 1
The absorption and emission wavelengths (l ), wavenumbers (n ), Stokes shift (D n ST) and fluorescence quantum yields (j fluor) of some natural egonol derivatives in methanol.

|
No |
Compound |
l abs (nm) |
e max (x104) |
n abs (cm-1) |
l fluor (nm) |
n fluor (cm-1) |
D n ST (cm-1) |
j fluor |
|
I |
Egonol |
317 |
2.75 |
31550 |
358 |
27900 |
3650 |
0.923 |
|
II |
Egonol acetate |
317 |
2.92 |
31550 |
358 |
27900 |
3650 |
0.922 |
|
III |
Egonol triglycoside |
317.5 |
2.95 |
31500 |
359 |
27840 |
3660 |
0.918 |
For a possible application of these compounds in biologically-oriented energy and charge transfer studies, we examined the behaviour of egonol molecule toward the p -electron donors and acceptors. For this aim, theoretical evaluations of the ground and excited states are done in order to find the ionisation potentials and electron affinities. The total energies were calculated in the ground and in the first singlet excited Frank-Condon state for neutral egonol molecule, and for the anion-cation radical forms, by a preliminary optimisation of molecular geometry. The ionisation potentials, calculated as difference of total energy between egonol molecule and its cation-radical, electron affinities, calculated as difference of total energy between egonol molecule and its anion-radical, and presented in table 2. As seen that ionisation potential decreases about twofolds from ground state to excited state and electron affinity increases more than threefold from ground state to excited state. Thus one may make the assumption, that the fluorescence of egonol can be quenched more efficiently by electron donors, compared to the electron acceptors.
Fluorescence quenching of egonol emission studies with strong p -electron donor molecule of carbazolocarbazole [14] and also by strong p -electron acceptor molecule of tetranitrofluorenone, prove the above theoretical evaluations [15]. Previous quenching experiments by the use of these quenchers, have proven the excessive high quenching abilities [16]. The bimolecular rate constants of quenching are reported to be above the limits for diffusion controlled reactions(> 1010 s-1 M-1), due to formation of charge transfer complexes even in the ground state.
Table 2
Ionisation potentials, Ip(eV) and electron affinities, EA (eV) of egonol, carbazolocarbazole and tetranitrofluorenone molecules, in the ground and first singlet excited state, S1* (only for excited egonol molecule, not for the quenchers) calculated by AM1 method.
EGONOL CARBAZOLOCARBAZ. TETRANITROFLUOR.
Ip at Ground State ......... 7.77 ....................... 7.54 ........................... 10.90 ...............
Ip at S1* ..................... 4.40
EA at Ground State ........ 1.34 ...................... 0.92 ............................ 3.84 ...............
EA at S1* ..................... 4.72
The fluorescence lifetime of egonol, which is necessary for calculation of the rate constant of quenching, was estimated on the basis of egonol quantum yield and fluorescence rate constant. The fluorescence rate constant was calculated from the corresponding electronic absorption spectrum [13]. The fluorescence lifetime is calculated to be t f = j f / kf = 2.57 ns, using j f = 0.92, and kf = 3.6× 10⁸ s-1 values. The absorption spectra of both donor carbazolocarbazole and acceptor tetranitrofluorenone quenchers lie at longer wavelengths in comparison with the absorptions of egonols. In addition, the donor quencher, carbazolocarbazole, has a very low fluorescence emission, j fluor< 0.1, that overlaps with the emission band of egonol. The effects described above were taken into account at calculations of Stern-Vollmer plots. The analytical wavelengths for quenchings are selected to be at minimum overlap values for emission band of egonol with the absorption or emission bands of added quenchers (343 nm for quenching by carbazolocarbazole and 400 nm for quenching by tetranitrofluorenone). "Inner filter" and reabsorption effects, aroused with increasing concentrations of quencher, were taking into account by the use described equations of (1)-(3). The Stern-Vollmer plots for quenching of egonol fluorescence by carbazolocarbazole and tetranitrofluorenone are seen in figures 6 and 7. In order to avoid overlapping of emission bands of egonol with the absorption bands of quencher molecule, in addition we have studied the quenching of egonol fluorescence band at l exc= 317 nm, with aniline and N,N-dimethylaniline molecules (figures 8 and 9). The quenching rates with aniline and N,N-dimethylaniline rapidly deviated from linearity above the concentrations of plots in figure 8 and figure 9.
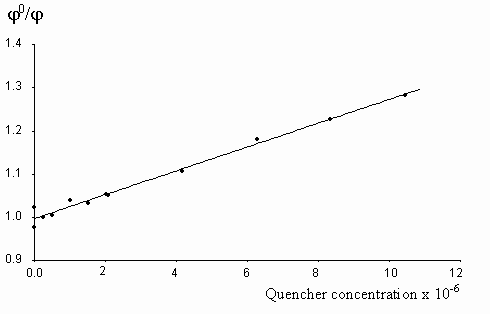
Figure 6. The Stern-Vollmer plot for the quenching of egonol(1x10⁻⁵ m) fluorescence in the presence of increasing carbazolocarbazole concentrations (0.1-12.5)x10-6 m in methanol solutions.
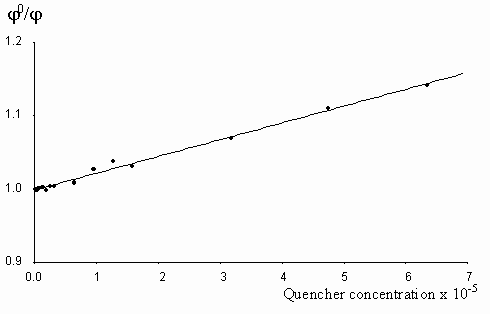
Figure 7. The Stern-Vollmer plot for the quenching of egonol(1x10⁻⁵ m) fluorescence in the presence of increasing tetranitrofluorenone concentrations (2-63)x10-6 m in methanol solutions.
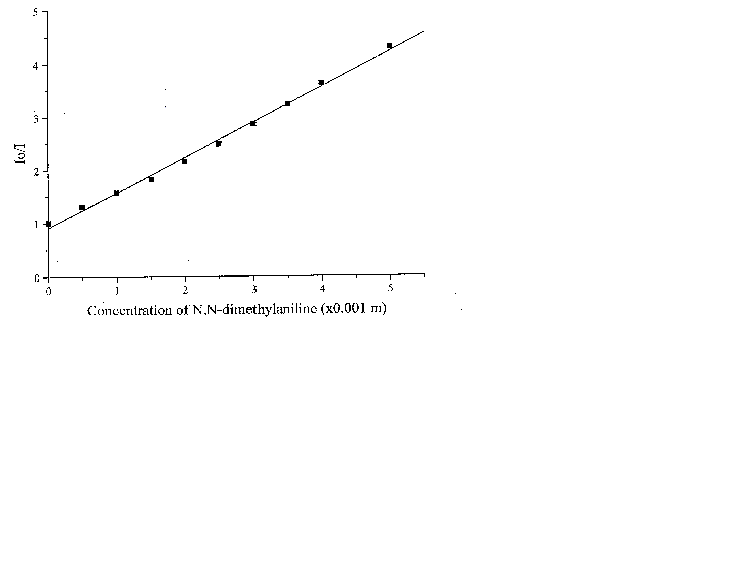
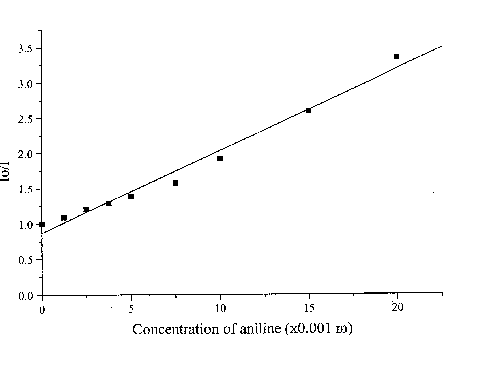
Figure 9. The Stern-Vollmer plot for the quenching of egonol(1x10⁻⁵ m) fluorescence in the presence of increasing aniline concentrations (1.3-20)x10-3 m in methanol solutions .
Fluorescence quenching rates of egonol, calculated from Stern-Vollmer plots are seen below:
Quencher Solvent l exc (nm) kf(s-1× mol-1)
Donors
Aniline Methanol 317 4.5x10¹⁰
N,N-Dimethylaniline Methanol 317 2.1x10¹¹
Carbazolocarbazole Methanol 343 5.6x10¹²
Acceptor
Tetranitrofluorenone Methanol 400 2.6x10¹¹
As seen, quenching rates are at or above the diffusion rate limits, for all the quenchers. Increasing p -electron donor capacity in the order of aniline-N,N-dimethylaniline-carbazolocarbazole, accordingly enhances the quenching rates of egonol emission about tenfold. The quenching rate constants are 5.6× 10¹² s-1× mol-1 for carbazolocarbazole-egonol pair and 2.6× 10¹¹ s-1× mol-1 for tetranitrofluorenone-egonol pair. Ionization potentials and electron affinities for egonol, carbazolocarbazole and tetranitrofluorenone is seen in table 2. The first excited state, S1*- Ip and S1*- EA values are calculated for only the egonol, because energy transfer process do not involve the excited states of quenchers. These results are in agreement with semi-empirical calculations, that the excited egonol molecule is a more effective electron-acceptor rather than an electron-donor. But effective fluorescence quenching is seen to be also present toward strong p -electron-accepting compounds, as with tetranitrofluorenone. The evaluated quenching rate constants are found to be above the value diffusion-controlled rate limits, similar observations are reported earlier [14-16]. A plausible participation of electron tunnelling between the quencher and the excited fluorescent egonol molecule in liquid state, can be proposed for justification of high efficiency on fluorescence quenching. Such electron tunneling in homogeneous and heterogeneous systems is being well defined by Grä tzel[17].
Conclusion
A natural benzofuran type compound, isolated from Styrax officinalis, egonol, is found to be effective luminophore, emitting light in the near UV region with a quantum yield values near 0.92. The quenching experiments show very high efficiency of quenching, and that the excited egonol molecules are more efficient electron acceptors, rather than electron donors.
Acknowledgments
The authors express their gratitude to NATO Scientific Affairs Division, Ege University Research Funds Office and TUBITAK-Scientific and Technical Research Counsel of Turkey (Project number TBAG-1564) for their supports.
References
1. R. Hegnauer, Chemotaxanomie der Pflanzen, 4, 473 (1973).
2. H. Okada, J. Pharm. Soc. Jpn., 657 (1915).
3. S. Kawai and K. Yamagami, Ber. 71B, 2438 (1938).
4. R. Segal, I. M. Goldzweig, S. Sokoloff and D. V. Zaitschek, J. Chem. Soc., 2402 (1967).
5. S. Kawai and K. Sugimota, Ber., 73 774 (1940).
6. H. Anıl,
Phytochemistry 19, 2784 (1980).7. W. A. Melhuish, J. Phys. Chem. 65, 229 (1961).
8. M. S. J. Dewar, E. G. Zoebich, E. G. Healy and J. J. P. Steward, J. Amer.Chem. Soc.
107, 3902 (1985).
Chapmann and Hall Ltd., New York, 1981.
10. M. A. El-Sayed, J. Phys. Chem., 38, 2834 (1963).
11. V. G. Plotnikov, Otp. Spektr., 22, 735 (1967).
12. V. G. Plotnikov, Otp. Spektr., 23, 39(1967).
Benjamin/Cummings Publ. Co., London, Amsterdam, Sydney, 1980.
14. S. Icli,. H. Icil, I. Gurol, Turk. J. Chem. 21, 363 (1997).
15. E. I. Kapinus, I. I. Dilung, Chem. Phys. Lett. 174, 75 (1990).
16. S. Icli, H. Icil, D. G. Whitten, C. Sayil, I. Dityapak, J. Lumin. 75 353 (1997).
Press Inc., Boca Raton, Florida, USA, 1989.