| Papers and Posters | Site Home Page |
QUANTIFICATION OF THE FORMATION OF FREE RADICALS
IN MACROPHAGE SYSTEMS
Dezs
o Gál, András Németh and Tamás KriskaInstitute of Chemistry, Chemical Research Center, Hungarian Academy of Sciences
Pusztaszeri út 59-67, Budapest 1025, Hungary
Abstract
A mechanism is suggested for the zymosan stimulated, luminol dependent chemiluminescence of macrophage system both in the absence and in the presence of free radical inhibitor. Based on the mechanism and relevant data of elementary rate constants computer simulation has been performed in order to describe the free radical formation and consumption, the kinetics of the chemiluminescence signal as well as the consumption of the inhibitor and luminol molecules in the course of the overall process.
Keywords chemiluminescence; macrophage system; oxidation of luminol; inhibition of luminol dependent chemiluminescence.
INTRODUCTION
According to literature data certain immune cells are able to generate free radicals (native free radicals) if stimuated by exogenous compounds and their interactions might lead to chemiluminescence (CL) registration of which serves as an excellent parameter for quantitative studies [1-3]. Since in certain cases these radicals do not react in bimolecular combination resulting in CL due to energetic reasons, or if they do, the intensity of CL is rather low, to follow it kinetically, as a rule, exogenous molecules are introduced into the system the interaction of which or of their transformation products with the native free radicals leads to measurable CL [4].
Recent publications, however, indicated, that accidentally molecules added to the system, might also contribute to the generation of free radicals, resulting in incorrect quantitative calculation of their formation and accumulation rates as well as of their steady state concentration (5-8).
Using a peritoneal macrophage cell system we have followed the kinetic
feature of zymosan induced free radical generation in the presence of luminol (Lum) [9]
and performed quantitative calculations and simulation of the experimental data based on
the effect of free radical inhibitor on CL and on a detailed mechanism of the oxidation of
Lum the latter producing superoxide anion radicals, (![]() ,) [10]. Although our calculations indicated that the additional formation of
free radicals is negligible if and when the corresponding rate for the native free
radicals is as low as comparable with the contribution by
,) [10]. Although our calculations indicated that the additional formation of
free radicals is negligible if and when the corresponding rate for the native free
radicals is as low as comparable with the contribution by ![]() , due to the lack of the elementary processes representing the consumption
of the inhibitor molecules, our earlier simulation can be considered incomplete and very
limited to the early stages of the overall process.
, due to the lack of the elementary processes representing the consumption
of the inhibitor molecules, our earlier simulation can be considered incomplete and very
limited to the early stages of the overall process.
In the present paper we intend to describe calculations based on an extended mechanism including reactions which correspond to the oxidation of luminol initiated by native free radicals, to the consumption of inhibitor molecules (InH) and to interactions of species formed in both overall processes.
RESULTS AND DISCUSSION
The mechanism
In order to describe formation, accumulation and consumption of native free radicals and the oxidation of luminol in the system the same mechanism has been used as in our earlier publications [9-10] and consequently it is not discussed here only summarized in Table 1. In addition, the relevant rate constants compiled and accepted as the best fit describing the reduced CL signal vs time curve in the early stages of the overall process up to the maximum are also tabulated.
If an inhibitor is introduced into the system at the start of the generation of native free radicals, following further elementary steps should be taken into account.
Interactions of InH with both radicals generated by the cells and by the oxidation of Lum as well as with Lum
. itself![]() (11)
(11)
![]() (12)
(12)
and
![]() (13)
(13)
Radicals In
. formed in processes (11-13) react with the native free radicals, with Lum , with each other and can attack Lum.:![]() (14)
(14)
![]() (15)
(15)
![]() (16)
(16)
![]() (17)
(17)
![]() (18)
(18)
Table 1.
Suggested mechanism for the
oxidation of luminol in the presence of
native free radicals [10]
No |
r e a c t i o n |
r a t e constant mol-1 s-1 |
ref. |
1 |
Lum + |
5x10³ |
[6] |
2 |
Lum + |
5x10³ |
[6] |
3 |
Lum. + O2 |
5.5x10² |
[6] |
4 |
Lum. + |
2.3x10⁸ |
[6] |
5 |
Lum. + |
2.3x10⁸ |
[6] |
6 |
|
0.8x10⁶ |
[13] |
7 |
|
0.8x10⁶ |
[13] |
8 |
|
0.8x10⁶ |
[13] |
9 |
Lum. + Lum. |
5x10⁸ |
[6] |
10 |
|
- d[InH]/dt |
own measurement |
It should be emphasized as it has been done earlier [9-10] that the mechanism of the formation of native free radicals within the cells is not represented by elementary processes and is assumed that their interaction proceeds overwhelmingly in the bulk of the solution. With other words, transfer of Lum, InH and species of their transformation into the cell is neglected. Support for this assumption was described already.
Rate constants of processes (11-18)
Since structurally ![]() ,
that is the native free radicals and radicals formed in process (3) are identically
superoxide anion radicals as discussed in the literature (4-5,11), k11 ş k12 and similarly k14 ş
k15. Concerning the numerical values of these constants following data can be
given. For k11 Burlakova et al. described a value of 2x10⁴ M-1s-1.
With respect to k16 Zaikov and coworkers used 6x10⁶ M-1s-1
while Foster et al. referred to 1.7x10⁶ M-1s-1
[11, 12]. Since the rate constant of the recombination of the superoxide anion radicals
(hydrogen peroxy radicals) was taken to be 0.8x10⁶ M-1s-1
already (see Table 1.) taking into account the „square root regulation„ for
combination processes it is expected that k6 < k14
ş k15
,
that is the native free radicals and radicals formed in process (3) are identically
superoxide anion radicals as discussed in the literature (4-5,11), k11 ş k12 and similarly k14 ş
k15. Concerning the numerical values of these constants following data can be
given. For k11 Burlakova et al. described a value of 2x10⁴ M-1s-1.
With respect to k16 Zaikov and coworkers used 6x10⁶ M-1s-1
while Foster et al. referred to 1.7x10⁶ M-1s-1
[11, 12]. Since the rate constant of the recombination of the superoxide anion radicals
(hydrogen peroxy radicals) was taken to be 0.8x10⁶ M-1s-1
already (see Table 1.) taking into account the „square root regulation„ for
combination processes it is expected that k6 < k14
ş k15 ![]() k16 for k14
, k15 , k16 an approximate value of ~ 5x10⁶ was assumed.
k16 for k14
, k15 , k16 an approximate value of ~ 5x10⁶ was assumed.
Concerning the combination of Lum
. with In. , that is process (17), it should be mentioned that for process (9) corresponding to the combination of radicals Lum. literature data refer to the value 5x10⁸, consequently it is expected that 0.8x10⁶ < k17 Ł 5x10⁸ and the latter has been accepted for simulation.With respect to process (18), the problem is more complex since similar consideration as done for combination reactions cannot be applied. It seems likely that inhibitor radical In
. is less reactive than the parent peroxy radical it inhibited, consequently a value for k18 ~ 1x10³ M-1s-1 has been accepted.Comparing k11 ~ k12 with k13 the latter should be k13 >> 2x10⁴ M-1s-1 .
Simulation of kinetics of CL at high conversions
As described earlier, for simulation the rate of formation of the native free radicals was obtained directly by measuring the consumption of inhibitor molecules during the inhibition period which was performed closely up to times corresponding to the maximum of the CL ® reaction time curve. During this period, assuming that the inhibitor does not affect the formation rates, the following expression can be accepted with good approximation:
w10 = - ( d[InH] / dt + d[Lum] / dt ) » - d[InH] / dt
supported by the fact that the lack of CL indicates that the consumption of Lum can be neglected compared to the consumption of InH and thus the rate of the consumption of the inhibitor molecules determined experimentally gives the rate of formation of native free radicals. Unfortunately, beyond the inhibition period, where the CL signal increases and differs from closely zero values which means that Lum molecules compete with InH to consume the native free radicals in measurable extent, above assumption is not valid anymore and thus:
![]()
Therefore, in order to compile the corresponding w10 values following reaction times above tmax, instead of the consumption of InH, the kinetics of CL signal for the period following the maximum was used by best fitting procedure with the same rate constants as before for simulation and given in Table 1. for uninhibited process.
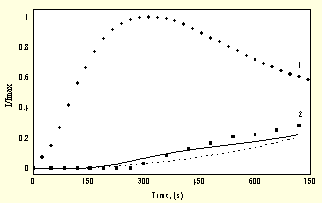
Simulation itself was carried out by the program package KINAL [13] and as input data the consumption of InH determined experimentally up to tmax was used. Figure 1. displays the reduced CL signal { I/Imax = (w4+w5)/(w4+w5)max } vs time curve in the presence of inhibitor added to the system initially and the simulated ones at two different k13 values (5x10⁴ and 5x10⁵ M-1s-1). Also the CL signal vs time curve measured in uninhibited process is shown.
.
.
Fig.1. Chemiluminescnece against time measured experimentally and simulated
1 : experiments carried out in the absence of inhibitor; 2 : the same in the presence of inhibitor.
(full line : simulation performed with k13 = 5x10⁴ M-1 s-1; dotted line : the same with k13 = 5x10⁵ M-1 s-1).
The best fit was achieved at k13 ~ 5x10⁵ M-1s-1.
We have shown earlier [10] that the amounts of free radicals formed in
the course of initiated oxidation of luminol are negligible compared to the amounts of
free radicals generated by cells unless the latter is as low as comparable with the
contribution by ![]() and this is valid for the
whole inhibition period apart from the very beginning of the overall process. The main
purpose of our calculation was to examine whether this finding is valid for the fall-off
region of CL up to high conversions, too. The corresponding concentrations
and this is valid for the
whole inhibition period apart from the very beginning of the overall process. The main
purpose of our calculation was to examine whether this finding is valid for the fall-off
region of CL up to high conversions, too. The corresponding concentrations ![]() and
and ![]() are given in Fig.2.
are given in Fig.2.
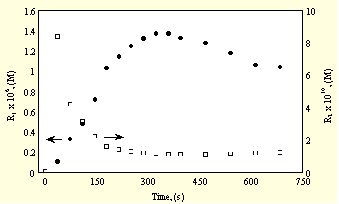
Fig.2. Kinetics of the accumulation of native free radicals, ![]() and free radicals
and free radicals
generated by the oxidation of luminol ![]()
It shows convincingly that under the experimental conditions applied
[10]: ![]() >>
>> ![]() .
.
Fig. 3. shows the steady state concentrations of [Lum
.] for the whole reaction period simulated both in the absence and presence of InH..
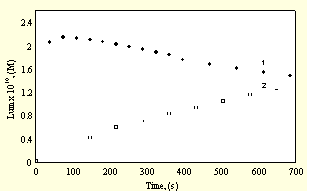
Fig.3.Concentration of Luminol radical vs time in the presence (1)
and in the absence of inhibitor (2)
In the absence of InH the kinetics of the steady state concentrations changes parallel to the reduced CL vs time, as a maximum curve and as expected if taking into account that the CL signal is generated by the interaction between Lum
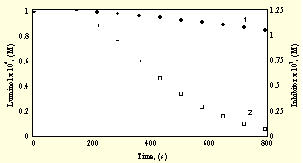
. and native free radicals + radicals generated by the oxidation of Lum. In the presence of decreasing amounts of InH, consumed initially by native free radicals, no maximum can be observed and [Lum.] increases continuously representing the competition between InH and Lum for native free radicals and at higher conversions also for radicals generated by the oxidation of Lum.Fig. 4. shows the rates of consumption of Lum and InH.
|
Fig.4. Kinetics of consumption of the inhibitor (1) and of Luminol (2)
It is worthwhile to mention that the rate of consumption of InH is slow compared to expected values observed in normal oxidation processes in the absence of luminol where during the inhibition period it is practically consumed in spite of the fact that CL is not observed during the inhibition period. The absence of Cl and consumption of Lum indicate that the CL yield is rather low for the interaction of Lum
. and native free radicals.Sensitivity analysis
As already shown normalized sensitivity coefficients defined as the change in actual concentrations of the species with respect to small variation of the rate constants indicated that the variation of w10 has the greatest effect on the concentrations of radicals involved in the expression of I/Imax. In the present investigation we analysed by brute force method the effect of error in the determination of the inhibitor concentration if measured close to the maximum of the CL signal. By best fit procedure we computed w10 against time assuming ± 5% error in the measurement. Results are displayed in Fi g.5.
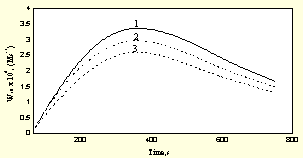
Fig.5 Sensitivity of the w10 values at errors committed in the analysis of the inhibitor concentration
( 1: +5% error, 2: 0% error, 3: -5% error)
They show convincingly that w10 = f(t) is significantly sensitive to the error in measuring the inhibitor concentration.
Acknowledgments
The financial help of the National Scientific Research Foundation (OTKA, No T026252) is highly appreciated.
REFERENCES
1. K. Van Dyke and V. Kastranova: Cellular chemiluminescence, CRC Press Inc., Boca Raton, Florida, 1987.
2. K. Stolze, A. Dadak, H. Nohl: Biochem. Pharmacol., 52 1821(1996).
3. V. Y. Shlyapintoch et al: Chemiluminescence methods for studying slow
chemical processes, Nauka, Moscow, (in Russian), 1966.
4. J. Lee, A. S. Wesley, J. F. Ferguson, H. H. Seliger: In F. H. Johnson and
Y. Haneda (eds.), Bioluminescence in Progress, p. 35 Princeton University
Press, Princeton, NJ, 1966.
5. K. Faulkner, I. Fridovich: Free Radical Biol. Med. 15, 447 (1993).
6. G. Merényi, J. Lind, T.E. Eriksen: J. Phys. Chem. 88, 2320 (1984).
7. A. Samuni, C.M. Krishna, J. Cook, C.D.V. Black, A. Russo: Free Radical
Biol. Med. 10, 305 (1991).
8. C.D.V Blacks, A. Samuni, J. Cook, C.M. Krishna, D.C. Kaufman, H.L
Malech,A. Russo: Arch. Biochem. Biophys. 286, 126 (1991).
9. D. Gál, T. Kriska, E. Maltseva: Biochem. Biophys. Res.
Commun. 233, 173 (1997).
10. A. Németh, J. Jakus, T. Kriska, Á:Keszler, R. Vanyur, D. Gál:
Biochem. Biophys. Res. Commun., 255, 360 (1999).
11. E.L.Shanina, G.E. Zaikov, V.A. Belyakov: Oxid. Commun. 21, 312
(1998).
12. T. Foster, A.J. Elliot, B.B. Adeleke, J.K.S. Wan: Can. J. Chem., 56, 869
(1978).
13. S. Marklund: J. Biol. Chem. 251, 7504(1976).
14. T. Turányi: Computers & Chemistry, 14(3), 253 (1990).
