| Papers and Posters | Site Home Page |
The Role of Solar UV on the Development of Macroalgal Assemblages of Greece
R. Santas1, D. Danielidis2, K. Koussoulaki1, M. Prost3, Ph. Santas1, and D.-P. Häder3
3 31
1OikoTechnics, Kefallenias 50, A. Helioupolis, GR-16342; e-mail: santas@hol.gr
2
University of Athens, Dept. Biology, Sect. Ecology and Systematics, Athens, Greece3
Friedrich-Alexander Universität, Staudtsr. 5, Erlangen, Germany
Key words
Algae, mycosporines, standing crop, community analysis, UV-A, UV-B
Abstract
The role of incident PAR, UV-A and UV-B radiation was investigated in macroalgal assemblages grown in partial enclosures in a natural marine habitat.
While seasonal changes in community structure were observed, the effects of light treatment on both community structure and standing crop were unclear. During the 12 month experimental period, monthly doses above surface varied by a factor of 6.4, 7.9, and 12.9 respectively. Exposure to UV radiation increased the mycosporine content of the assemblages. UV protection provided by these screening pigments along with the wide natural variations in light doses and spectral composition are likely explanations for the absence of inhibitory UV effects.
Introduction
The increase in solar ultraviolet radiation due to stratospheric ozone depletion1,2,3 has raised much scientific and public concern during the last years. UV radiation affects the biology of living organisms and, therefore, the balance of natural ecosystems. Most terrestrial and aquatic plant organisms are unable to avoid direct exposure to sunlight. Benthic algae can be especially susceptible to ultraviolet radiation4 as they lack the protective tissue layers and UV absorbing pigments present in higher plants. Ultraviolet radiation inhibits the growth of many marine primary producers including benthic and planktonic microalgae5, green algae6 and several shallow and deep water species of red algae6,7. UV has been shown to damage the photosynthetic systems of green algae8,9. However, the presence of UV-screening mycosporine-like amino acids (MAAs) has been reported in certain macroalgal species10. Mycosporines show an absorption maximum around 335 nm and have been also found in other marine organisms11. MAA protection against the damaging effect of short wavelength radiation has been demonstrated in a wide variety of plants12.
Enhanced simulated ultraviolet radiation affects microalgal community structure13,14.
The present study was carried out to investigate the role of ambient ultraviolet radiation on the productivity and structure of naturally grown macroalgal assemblages. Furthermore, mycosporine production in relation to light exposure is discussed.
Methods and Materials
Experiments were conducted at a distance of 50m from an east-facing rocky shore of Saronikos Gulf, near Korinthos, Greece (37o 58
? N, 23o 0?E). Ceramic tiles (10x10cm) were used as a substrate for algal attachment and growth. The ceramic tiles were placed in partial enclosures which allowed for free current flow over the developing algal mats (for a picture of the experimental apparatus see Reizopoulou et al.15). The enclosures were suspended from PVC rafts at 0.5, 1.0 and 1.5 meters for periods of 9,10 and 12 months. Using UV-transmitting Plexiglas (GS 2458) and plastic foil cutoff filters (295 Ultraphan; PR Montagefolie 320nm Art. Nr. 10155 099; and 395 Ultraphan UV Opak; thickness: 0.3mm) 3 light regimes were established (PAR, PAR+UV-A, PAR+UV-A+UV-B). A total of 9 treatments combinations (light regimes x 3 depths) were performed in duplicate. The filters were cleaned regularly every two days to prevent alteration of the transmittance properties due to fouling.On March 16, April 18 and June 25, 1996, i.e. after 9, 10 and 12 months of growth one ceramic tiles was removed at random from the designated treatment combinations. The entire growth from each tile was used for algae identification
16,17,18,19 and enumeration. Subsequently the biomass was collected on fiberglass filters, rinsed with deionized water, and allowed to dry to constant weight at 80o C. The biomass data were subjected to analysis of variance. Multivariate community analysis was performed with the Primer software (Plymouth Marine Laboratory).At the end of the experiment (12 months), pigments were extracted in methanol to assess mycosporine production at the community level.
Results
Light doses
The natural levels of solar incidence above surface varied dramatically during the one year growth period (fig. 1). The maximum monthly dose for PAR (August 1995; 302,051 kJ m-2) was 6.4 times higher than the winter minimum (December 1995; 47,397 kJ m-2). The differences in the UV-A and UV-B doses were even sharper. The August/December ratios for these two bands were 7.9 and 12.9 respectively.
Figure 1: Monthly doses of PAR, UV-A and UV-B as measured with an ELDONET light dosimeter above surface. UV-A values multiplied by a factor of 10. |
Biomass data
Average biomass values for all three sampling events are listed in Table 1.
Table 1: Standing crop (g m-2)
| Treatments | 16/3/1996 |
18/4/1996 |
25/6/1996 |
March |
April |
June |
|
| PAR+UVA +UVB 0.5m | 353.9 |
433.3 |
232.3 |
| PAR+UVA +UVB 1.0m | 355.8 |
241.2 |
231.9 |
| PAR+UVA +UVB 1.5m | 342.7 |
222.8 |
214.6 |
| PAR+UVA 0.5m | 429.5 |
378.4 |
258.9 |
| PAR+UVA 1.0m | 225.2 |
233.2 |
286.4 |
| PAR+UVA 1.5m | 257.0 |
361.9 |
255.9 |
| PAR 0.5m | 447.7 |
309.9 |
240.7 |
| PAR 1.0m | 343.5 |
156.6 |
170.7 |
| PAR 1.5m | 259.0 |
106.4 |
197.8 |
A two-way ANOVA (month vs. light-depth treatment combination) revealed that a) in April, the biomass of the PAR+UV-A+UV-B at 0.5 m was significantly higher than the PAR treatments at both 1.0 and 1.5 m, b) in March and June no significant differences in biomass between the nine light - depth treatment combinations unlike April when the PAR treatment at 1.5 m was significantly lower than PAR+UV-A at 0.5 and 1.5 m and PAR+UV-A+UV-B at 0.5 m, and c) within light-depth combinations no significant differences were observed among the three months (Fig. 2).
Figure 2: Average biomass under the 9 treatment combinations. Error bars: 95% confidence intervals. Non-overlapping error bars indicate significant differences.
|
Community analysis
During the first months of substrate colonization the assemblages were dominated by diatom species. These results are presented elsewhere
15. The structure of the assemblages gradually changed with the appearance of filamentous macroalgal species. Community development was slower during the winter months. After the end of the cold season a dense mat of macroalgae formed on the ceramic tiles. The macroalgal assemblages comprised a total of 60 species of red, green and brown algae. Species found in all sample events are listed in Table 2. The group with the greatest number of representative taxa was Rhodophyceae with a total of 41 species, followed by Chlorophyceae (10 species) and Phaeophyceae (9 species). The largest number of species (8) within a genus was recorded for the red alga Ceramium.General remarks: Tables 3-5 list the semiquantitative abundances of the 12 most common algae. The number of species present under all light treatments (and most depths) increased from 5 (March) to 8 (April) to 10 (June). Laurencia was present only at 0.5 m, always under PAR+UVA, in one occasion under PAR+UVA+UVB, always absent from PAR. Crouania was absent from the PAR+UVA treatment at all dates and depths.
Table 2: Filamentous macroalgal species |
Rhodophyceae |
Phaeophyceae | Chlorophyceae | |
| Acrochaetium daviesii | Dasya rigidula | Colpomenia peregrina | Acetabularia acetabulum |
| Alsidium helmidochorton | Erythrotrichia carnea | Dictyota linearis | Bryopsis pennata |
| Antithamnion cruciatum | Falkenbergia rufolanosa | Giffordia mitchellae | Cladophora coelothrix |
| Antithamnion heterocladum | Fosliela farinosa | Giffordia granulosa | Cladophora dalmatica |
| Aphanocladia stichidiosa | Gelidiella pannosa | Gigardua sphacelarioides | Cladophora pellucida |
| Antithamnion tenuissimum | Gelidium latifolium | Padina pavonica | Enteromorpha ahleriana |
| Calithamnion corymbosum | Goniotrichum alsidii | Sphacelaria plumula | Enteromorpha clathrata |
| Centroceras clavulatum | Goniotrichum cornu-cervi | Sphacelaria tribuloides | Enteromorpha compressa |
| Ceramium byssoideum | Griffithsia tenuis | Stypocaulon scoparium | Enteromorpha multiramosa |
| Ceramium cinabarium | Herposiphonia tenella | Ulva curvata | |
| Ceramium cingulatum | Heterosiphonia wurdemanni | ||
| Ceramium circinatum | Jania rubens | ||
| Ceramium diaphanum | Laurencia papilosa | ||
| Ceramium taylori | Lophosiphonia cristata | ||
| Ceramium tenuissimum | Lophosiphonia scopulorum | ||
| Ceramium tenerrimum | Plocamium cartilagineum | ||
| Chondria tenuissima | Polysiphonia elongata | ||
| Chroodactylon ornatum | Polyisiphonia banyulensis | ||
| Compsothamnion thuyoides | Pterosiphonia parasitica | ||
| Coralina granifera | Rhodophylis divaricata | ||
| Crouania atenuata | |||
Specific remarks: In March (Table 3), five species (Gelidiella, Fosliella, Polysiphonia, Cladophora, Giffordia) were present in most treatment combinations. Giffordia was the most abundant. Lophosiphonia was randomly present at very low numbers in all treatments. Heterosiphonia and Sphacelaria were present at very low numbers only under PAR (Heterosiphonia at 0.5 and 1.0 m; Sphacelaria at 1.0 and 1.5 m.) Crouania and Jania were abundant under PAR+UVA+UVB, absent from PAR+UVA, and present at low numbers under PAR.
In April (Table 4), Heterosiphonia was again present only under PAR at 0.5 m. Crouania and Acetabularia were present in low numbers under PAR+UVA+UVB and PAR and absent from PAR+UVA. Lophosiphonia, Gelidiella, Jania and Fosliella were present in most treatment combinations in relatively small numbers, while Giffordia, Polysiphonia, Cladophora, Sphacelaria were more abundant.
Table 3: MARCH (9 months)
| Species | PAR+UVA+UVB |
PAR+UVA |
PAR |
||||||
depth (m) |
0.5 |
1.0 |
1.5 |
0.5 |
1.0 |
1.5 |
0.5 |
1.0 |
1.5 |
Crouania attenuata |
+ | ++ | ++ | - | - | - | - | + | + |
Gelidiella pannosa |
+++ | + | ++ | + | + | ++ | - | + | + |
Jania rubens |
++ | + | + | - | - | - | + | - | - |
Fosliella farinosa |
+ | + | + | + | + | + | - | + | + |
| Polysiphonia elongata | + |
+ | + | ++ | ++ | + | +++ | - | ++ |
| Heterosiphonia wurdemanni | - |
- |
- |
- |
- |
- |
+ |
+ |
- |
| Laurencia papilosa | ++ |
- |
- |
+++ |
- |
- |
- |
- |
- |
| Cladophora pellucida | + |
+ |
+ |
++ |
- |
+ |
++ |
+++ |
++ |
| Giffordia michellae | +++ |
+++ |
+++ |
+++ |
+++ |
+++ |
+++ |
+++ |
++ |
| Lophosiphonia cristata | + |
- |
- |
- |
- |
+ |
- |
+ |
- |
| Acetabularia acetabulum | - |
- |
- |
- |
- |
- |
- |
- |
- |
| Sphacelaria tribuloides | - |
- |
- |
- |
- |
- |
- |
+ |
+ |
Table 4: APRIL (10 months)
| Species | PAR+UVA+UVB |
PAR+UVA |
PAR |
||||||
depth (m) |
0.5 |
1.0 |
1.5 |
0.5 |
1.0 |
1.5 |
0.5 |
1.0 |
1.5 |
| Crouania attenuata | ++ |
- |
- |
- |
- |
- |
++ |
+ |
+ |
| Gelidiella pannosa | + |
+ |
- |
+ |
+ |
- |
+ |
++ |
++ |
| Jania rubens | + |
+ |
- |
- |
+ |
- |
+ |
+ |
+ |
| Fosliella farinosa | + |
+ |
- |
- |
+ |
+ |
+ |
+ |
+ |
| Polysiphonia elongata | + |
++ |
++ |
+ |
++ |
++ |
- |
+ |
- |
| Heterosiphonia wurdemanni | - |
- |
- |
- |
- |
- |
+ |
- |
- |
| Laurencia papilosa | - |
- |
- |
+++ |
- |
- |
- |
- |
- |
| Cladophora pellucida | ++ |
+++ |
++ |
+ |
+ |
++ |
+ |
++ |
+++ |
| Giffordia michellae | +++ |
++ |
+ |
++ |
+++ |
++ |
+++ |
+++ |
+ |
| Lophosiphonia cristata | - |
+++ |
++ |
- |
+ |
- |
+ |
++ |
++ |
| Acetabularia acetabulum | - |
+ |
- |
- |
- |
- |
+ |
- |
++ |
| Sphacelaria tribuloides | + |
+ |
+ |
+ |
++ |
++ |
+ |
+ |
++ |
Table 5: JUNE (12 months)
| Species | PAR+UVA+UVB |
PAR+UVA |
PAR |
||||||
depth (m) |
0.5 |
1.0 |
1.5 |
0.5 |
1.0 |
1.5 |
0.5 |
1.0 |
1.5 |
| Crouania attenuata | - |
- |
- |
- |
- |
- |
- |
+ |
+ |
| Gelidiella pannosa | +++ |
++ |
+++ |
+++ |
+++ |
+++ |
+ |
+++ |
+++ |
| Jania rubens | + |
+ |
+ |
+ |
+ |
+ |
+ |
+ |
++ |
| Fosliella farinosa | + |
+ |
+ |
+ |
+ |
+ |
+ |
+ |
+ |
| Polysiphonia elongata | + |
++ |
+ |
++ |
+ |
+ |
+ |
+ |
+ |
| Heterosiphonia wurdemanni | - |
+ |
+ |
+ |
+ |
+ |
+ |
+ |
+ |
| Laurencia papilosa | - |
- |
- |
+ |
- |
- |
- |
- |
- |
| Cladophora pellucida | ++ |
++ |
++ |
+ |
+ |
+ |
++ |
+ |
+ |
| Giffordia michellae | + |
+ |
- |
+ |
+ |
+ |
++ |
+ |
++ |
| Lophosiphonia cristata | + |
++ |
+ |
++ |
+ |
+ |
+ |
+ |
+ |
| Acetabularia acetabulum | +++ |
++ |
++ |
++ |
++ |
+ |
++ |
++ |
+ |
| Sphacelaria tribuloides | ++ |
+++ |
++ |
+ |
+ |
+ |
+++ |
+++ |
+++ |
(+): Relative abundance 0<5%; (++) >5-20%; (+++) >20%
In June (Table 5), Crouania was present only under PAR in low numbers. All other species were present in most light and depth treatments at moderate-high numbers. The most abundant algae were Gelidiella and Acetabularia.
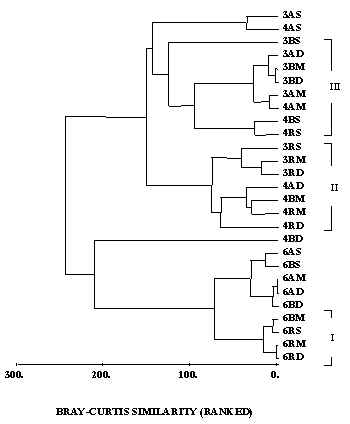
Multivariate analyses indicated clear seasonal trend in community structure (figs.2, 3). June 1996 samples form a distinct group, while the separation between March and April is less clear. Some clustering of light and/or depth treatments can be observed. However, the effects of these factors on community composition are not consistent. For example, the three PAR treatments group together, but a UVB treatment is also present (Fig 2: cluster I); cluster II consists of five PAR treatments, one UV-A and one UV-B; cluster III includes six UV-A and UV-B treatments, 1.0 and 1.5 meters, and one 'stranger' (PAR, 0.5 m).
Production of screening pigments
At the end of the growth period (12 months), samples were taken from each light regime and pigments were extracted in methanol. The absorption spectra of the methanol extracts were taken (Fig. 4) and the ratio between the chlorophyll peak at 666 nm and the mycosporine peak at 336 nm was determined (Table 6). High ratios indicate increased mycosporine content. Mycosporine content correlates both with spectral composition and amount of UV radiation (Table 6). At 0.5 m, mycosporine content was highest under the PAR+UV-A+UV-B treatment and lowest in the PAR treatment. In addition, in the PAR+UV-A+UV-B treatment, mycosporine content decreased with depth, while in the PAR treatment it remained rather constant. In the PAR+UVA treatment, mycosporine content decreased sharply from 0.5 to 1.0 m.
Figure 4: Absorbance spectrum of methanol extracts from the macroalgal
assemblages (12 months, 0.5 m). The peaks at 336 and 666 nm correspond to mycosporine and
chlorophyll content. (Curves normalized over chlorophyll content.) Table 6: Ratio of the absorption peaks at 336 nm and 666 nm in macroalgal
assemblages (mean values of four samples). |
Depth |
UVA + UVB + PAR | UVA + PAR | PAR |
0.5m |
3.21 |
3.17 |
2.68 |
1.0m |
2.73 |
1.82 |
2.78 |
1.5m |
2.06 |
2.11 |
2.64 |
Discussion
Naturally occurring UV radiation did not have any negative effects on standing crop. In one case (April), the PAR treatment at 1.5 m had a lower standing crop than both the PAR+UV-A+UV-B and the PAR+UV-A treatments at 0.5 (Fig. 2). This suggests that inhibition due to light attenuation in the water column is more significant than inhibition due to UVR.
Community analysis revealed seasonal patterns in the composition of the algal assemblages. The distribution of certain species seems to be related to light treatment. However, overall community structure did not correlate clearly with light treatment. Previous studies have shown that although UV exposure affects the structure of diatom assemblages during early primary succession, the differences disappear within 6 weeks
20,21,22.The absence of UV effects can be explained by a) the wide seasonal fluctuations in solar incidence, and b) the increased mycosporine production by the UV-exposed algae.
Solar incidence varied dramatically within the course of the year. Even during the four month sampling period (March 96 – June 96) the total dose for the 3 bands of the solar spectrum increased by a factor greater than 2 (Fig. 1). Spectral composition also changes significantly with time of the year (see max/min ratios of the dose of three bands under 'Results, Light doses'). Such complex patterns of exposure and spectral composition challenge the predictive value of results obtained from constant, short-term exposure of organisms in controlled laboratory experiments
23.Screening pigment content correlated with light treatment. UV-A and UV-B radiation induced mycosporine production, providing a protection and adaptation mechanism against changes in light intensity and spectral composition.
In conclusion, the deleterious effects of UVR demonstrated in laboratory experiments are often not supported by the findings of field studies. Although the UV ecology and physiology of certain species of macroalgae deserves further investigation, adverse UV effects, if they exist, can be masked by the overwhelming influence of other environmental factors such as season and natural light fluctuations, as well as physiological adaptation mechanisms of the organisms exposed.
Acknowledgments
This study has been funded by EC grants EV5V-CT94-0425 to R.S. and ENV4-CT96-0191 to D.-P.H. (DG-XII, Environment Programme). The authors are grateful to Dr. I. Bittis for his help on macroalgae identification.
References
- Cutchis, P. (1974) Stratospheric ozone depletion and solar ultraviolet radiation on earth. Science 184: 13-19.
- Molina, M.J., Molina, L.T. (1992) Stratospheric ozone. A. C. S. Symp. Ser. Am. Chem. Soc. Washington, D.C. 483, 24-35.
- Biggs, R. H. and Joyner, M. (1994) Stratospheric ozone depletion/UVB radiation in the biosphere. NATO advanced Research Workshop. Springer-Verlag, Berlin.
- Polne, M. And Gibor, A. (1982) The effect of high intensity UV radiation on benthic marine algae. In: Calkins, J. (Ed) The role of solar ultraviolet radiation in marine ecosystems. pp. 573-579, Plenum Press, New York.
- Worrest, R. C. (1983) Impact of solar ultraviolet-B radiation upon marine microalgae. Physiol. Plant. 58: 428-434.
- Halldal, P. (1964) Ultraviolet action spectra of photosynthetic inhibition in a green and a red alga. Physiol. Plant. 17: 414-421.
- Maegawa, M., Kunieda, M. and Kida, W. (1993) The influence of ultraviolet radiation on the photosynthetic activity of several red algae from different depths. Jpn. J. Phycol. 41: 207-214.
- Jokiel, P. L. and York, R. H. (1984) Importance of ultraviolet radiation in photoinhibition of microalgal growth. Limnol. Oceanogr. 29: 192-199.
- Agrawal, S. B. (1992) Effects of supplemental UVB radiation on photosynthetic pigment, protein and glutathione contents in green algae. Env. Exp. Bot. 32: 137-143.
- Takano, S., Nakanishi A,. Uemura D. & Hirata, Y. (1979) Isolation and structure of a 334nm UV-absorbing substance porphyra-334 from the red alga Porphyra tenera Kjellman. Chem. Lett.: 419-420.
- Karentz, D., McEuen, F. S., Land, M. C. and Dunlap, W. C. (1991) Survey of mycosporine-like amino acid compounds in Antarctic marine organisms: potential protection from ultraviolet exposure. Mar. Biol., 108:157-166.
- Karenz, D., Bothwell, M.L., Coffin, R.B., Hanson, A., Herndl, G.J., Kilham, S.S., Lesser, M.P., Lindell, M., Moeller, R.E., Morris, D.P., Neale, P.J., Sanders, R.W., Weiler, C.S., Wetzel, R.G. (1994). Impact of UVB radiation on pelagic freshwater ecosystem: Report of working group on bacteria and phytoplankton, Arch. Hydrobiol. Beiheft 43 (Special issue), pp. 31-69
- Santas, R. (1989) Effects of solar ultraviolet radiation on tropical algal communities. Ph.D. Dissertation, The George Washington University, Washington, DC.
- Cramer, J. (1983) Iconographie d’Algues Méditerranéennes. Bibliotheca phycologica, band 63.
- Reizopoulou, S., Santas, Ph., Danielidis, D., Häder, D.-P., and Santas, R (1999) UV Effects on Invertebrate and Diatom Assemblages of Greece. 2nd Internet Conf. on Photochem. Photobiol.
- Santas, R., Korda, A., Lianou, Ch. and Santas, Ph. (1998) Community responses to UV radiation. I. Enhanced UVB effects on biomass and community structure of filamentous algal assemblages growing in a coral reef mesocosm. Mar. Biol., 131:153-162.
- Bliding, C. (1963) A critical survey of European taxa in Ulvales. Part I: Capsosiphon, Percursaria, Blindingia, Enteromorpha. Opera botanica, 8:3.
- Feldmann-Mazouer, G. (1940) Recherches sur les Céramiacées de la Méditerranée occidentale.
- Cardinal, A. (1964) Étude sur les Ecrocarpacées de la Manche. Beihefte zur Nova Hedwigia, Heft 15.
- Santas R., Häder, D.-P., Lianou, C. (1996) Effects of solar UV radiation on diatom assemblages of the Mediterranean. Photochem. Photobiol. 64(3): 435-439
- Santas R., Danielidis, D., Lianou, C. (1997) UVB radiation and depth interaction during primary succession of marine diatom assemblages of Greece. Limnol. Ocean. 42(5):986-991
- Santas, R., Santas, Ph., Lianou, Ch. and Korda, A. (1998) Community responses to UV radiation. II. Effects of solar UVB effects on field-grown diatom assemblages of the Carribean. Mar. Biol., 131:163-171.
- Santas, R., Koussoulaki, A., Häder, D.-P. (1997). In assessing biological UV-B effects, natural fluctuations of solar radiation should be taken into account. Plant Ecol. 128: 93-97